Technical Analysis for Crypto: Make Smarter Investments

Technical analysis in cryptocurrency investing involves using historical price charts and indicators to predict future price movements and make informed trading decisions, helping investors navigate the volatile crypto market more effectively.
The cryptocurrency market’s volatility can be daunting, but understanding how to use technical analysis to make better cryptocurrency investment decisions can provide you with a powerful tool to navigate the fluctuations and identify potential opportunities. By learning to interpret charts, indicators, and patterns, you can make more informed investment choices.
Understanding Technical Analysis in Cryptocurrency
Technical analysis, in the context of cryptocurrency, is the process of evaluating cryptocurrencies by analyzing historical market data, such as price and volume. The primary goal is to identify patterns and trends that can help predict future price movements. This approach is widely used by traders and investors to make informed decisions about when to buy or sell cryptocurrencies.
The Basic Principles of Technical Analysis
At its core, technical analysis is based on a few key principles. One fundamental principle is that history tends to repeat itself, meaning that past price patterns can provide insights into future price movements. Another core belief is that prices reflect all available information, making the study of price action crucial for decision-making.
- 📚 History Repeats Itself: Past price patterns often provide clues to future movements.
- 📈 Prices Reflect All Information: Market prices incorporate all available knowledge.
- 🛡️ Trends Are Your Friend: Identifying and following trends can be highly profitable.
Understanding these principles is key to starting your journey with technical analysis. As you delve deeper, you’ll discover various tools and techniques that can enhance your ability to interpret market behavior and make smarter investment decisions.
In essence, understanding technical analysis will provide you with a different and insightful perspective on price movements, ultimately improving your decision-making process.

Key Tools and Indicators for Crypto Technical Analysis
To effectively use technical analysis in cryptocurrency, you need to be familiar with several key tools and indicators. These tools help you interpret market data, identify trends, and anticipate potential price movements.
Moving Averages (MAs)
Moving averages smooth out price data by creating an average price over a specified period. They help identify the direction of the trend and potential support and resistance levels. Common moving averages include the 50-day and 200-day MAs, which are frequently used to gauge long-term trends.
Relative Strength Index (RSI)
The Relative Strength Index (RSI) is a momentum oscillator that measures the speed and change of price movements. It ranges from 0 to 100 and is used to identify overbought (above 70) and oversold (below 30) conditions in the market.
- 📊 Moving Averages: Smooth price data to identify trends and support/resistance.
- 🧭 RSI: Measures the speed and change of price movements to find overbought/oversold levels.
- 🔄 MACD: Reveals changes in the strength, direction, momentum, and duration of a trend.
Mastering these tools and indicators requires practice and observation, but they are fundamental for conducting effective technical analysis in the cryptocurrency market.
By integrating these tools into your analysis, you can gain a more comprehensive view of market dynamics and make more informed trading decisions.
Reading Cryptocurrency Charts: Candlestick Patterns
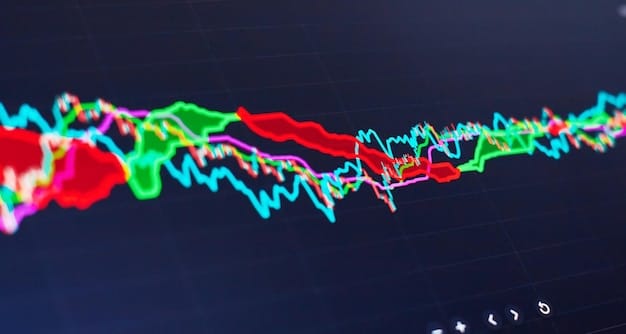
Candlestick charts are a popular way to visualize price movements over time. Each candlestick represents the open, high, low, and close prices for a specific period. Understanding candlestick patterns can provide valuable insights into market sentiment and potential trend reversals.
Common Candlestick Patterns
There are several common candlestick patterns that traders look for. These include bullish patterns like the “hammer” and “bullish engulfing,” which suggest potential upward price movements. Bearish patterns, such as the “hanging man” and “bearish engulfing,” indicate potential downward movements.
Interpreting Chart Patterns
Besides individual candlestick patterns, chart patterns like head and shoulders, double tops, and triangles can provide further insights. These patterns help traders identify potential breakouts and trend continuations.
- 📈 Bullish Patterns: Hammers and bullish engulfing suggest upward price movements.
- 📉 Bearish Patterns: Hanging man and bearish engulfing indicate potential downward movements.
- 📐 Chart Patterns: Head and shoulders, double tops, and triangles identify breakouts and continuations.
Learning to interpret candlestick and chart patterns enhances your ability to time your entries and exits in the crypto market, ultimately influencing the accuracy of your predictions.
By practicing the identification and interpretation of candlestick patterns on live charts, you can refine your technical analysis skills and improve your decision-making in trading scenarios.

Identifying Support and Resistance Levels in Crypto
Support and resistance levels are key concepts in technical analysis. Support levels are price levels where a downtrend is expected to pause due to a concentration of buyers. Resistance levels are price levels where an uptrend is expected to pause due to a concentration of sellers.
Drawing Support and Resistance Lines
To identify support and resistance levels, traders often draw lines connecting significant highs and lows on a price chart. These lines can act as potential areas where the price might bounce or stall.
Using Support and Resistance in Trading
Understanding these levels can help you determine optimal entry and exit points, set stop-loss orders, and anticipate potential price reversals. When the price nears a support level, it can present a buying opportunity. Conversely, approaching a resistance level might signal a good time to sell.
- 🤝 Support Levels: Price levels where buying interest is strong enough to prevent further decline.
- 🛑 Resistance Levels: Price levels where selling pressure can halt or reverse an uptrend.
- 🚀 Breakouts: Occur when the price moves decisively above a resistance level.
By mastering the ability to identify and utilize support and resistance, you can dramatically improve your trading strategies and maximize your profit potential while managing risks accordingly.
Effectively using support and resistance levels requires a combination of theoretical knowledge and practical charting experience, so continuous practice is essential.
Combining Multiple Indicators for Stronger Signals
While individual indicators can provide valuable insights, combining multiple indicators can create stronger and more reliable trading signals. This approach helps to filter out false signals and confirm potential trading opportunities.
Examples of Indicator Combinations
One common combination is using moving averages with RSI to confirm trends and identify overbought or oversold conditions. For example, if the price is above its 200-day moving average and the RSI is below 30, it could signal a strong buying opportunity.
Correlation and Divergence
Another effective technique is to look for correlation and divergence between different indicators. If two indicators are moving in the same direction, it strengthens the signal. Conversely, divergence can signal a potential trend reversal.
- ✅ Confirmation: Using multiple indicators to confirm a signal.
- 🔄 Filtering: Reducing false positives by requiring agreement between indicators.
- ⚖️ Correlation: Indicators moving in the same direction strengthen the signal.
By skillfully combining indicators, you enhance the accuracy and efficiency of your trading strategies, enabling more confident and profitable investment decisions.
The key to successful indicator combinations involves understanding each indicator’s strengths and weaknesses and how they complement each other within a trading strategy.
Risk Management with Technical Analysis
No discussion of technical analysis would be complete without considering risk management. Managing risk is just as crucial as identifying profitable trading opportunities. Technical analysis provides several tools to help manage and mitigate risk.
Setting Stop-Loss Orders
One of the most important aspects of risk management is setting stop-loss orders. A stop-loss order is an order to sell a cryptocurrency if it reaches a certain price level, limiting potential losses. Technical analysis can help you identify appropriate levels for stop-loss orders based on support and resistance levels or chart patterns.
Position Sizing
Another key element of risk management is position sizing. Determining the appropriate amount of capital to allocate to a trade can significantly impact your overall risk. By analyzing market volatility and potential price movements, you can adjust your position size to manage your risk exposure.
- 🛑 Stop-Loss Orders: Automated orders to limit losses by selling at a predetermined price.
- 💰 Position Sizing: Determining the appropriate amount of capital to allocate per trade.
- 🛡️ Risk-Reward Ratio: Assessing potential gains versus potential losses to ensure a favorable trade.
Effectively managing risk through stop-loss orders and appropriate position sizing not only ensures the security of your capital but also promotes long-term profitability.
Remember, no trading strategy is foolproof, and risk management is essential to protecting your investments in the volatile cryptocurrency market.
| Key Point | Brief Description |
|---|---|
| 📊 Chart Reading | Understanding candlestick and chart patterns for market insights. |
| 📈 Support/Resistance | Identifying key levels for potential price bounces or stalls. |
| 🛡️ Risk Management | Using stop-loss orders and position sizing to protect investments. |
| 🔑 Key Indicators | Utilizing indicators like RSI and moving averages. |
Frequently Asked Questions
▼
Technical analysis in crypto involves using historical price data and indicators to predict future price movements and is a strategy used by investors.
▼
Moving averages smooth out price data, highlighting the direction of the current trend and indicating potential support and resistance levels.
▼
RSI, or Relative Strength Index, measures the speed and change of price movements, helping to identify overbought and oversold conditions.
▼
Risk management, including setting stop-loss orders, protects capital from excessive losses due to market volatility and unexpected price changes.
▼
Combining indicators can filter out false signals and confirm potential trading opportunities, leading to more reliable and informed trading decisions.
Conclusion
By understanding and applying these technical analysis techniques, you can make more informed and strategic cryptocurrency investment decisions. Remember, continuous learning and adaptation are key to success in the dynamic world of crypto trading.


